See exactly where revenue is slipping
Reality unifies performance, engagement, and conversion data in one diagnostic platform. Every signal that impacts revenue, every breakdown that explains it, every what-if you need to act - powered by AI.
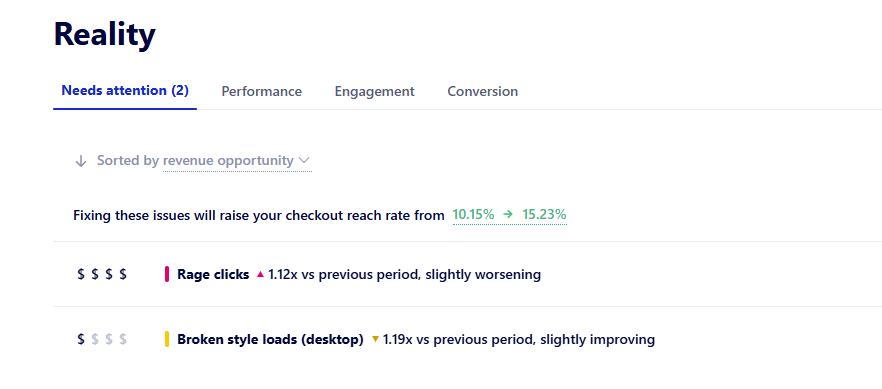
The first place every Monday morning
Reality flags issues directly tied to lost conversions - broken navigations, slow checkouts, frustrated sessions. No more digging through reports to find what actually matters.
- Issues ranked by revenue impact, not severity
- Each card shows the page, the metric, and the cost
- Tap any item to jump straight into the diagnosis
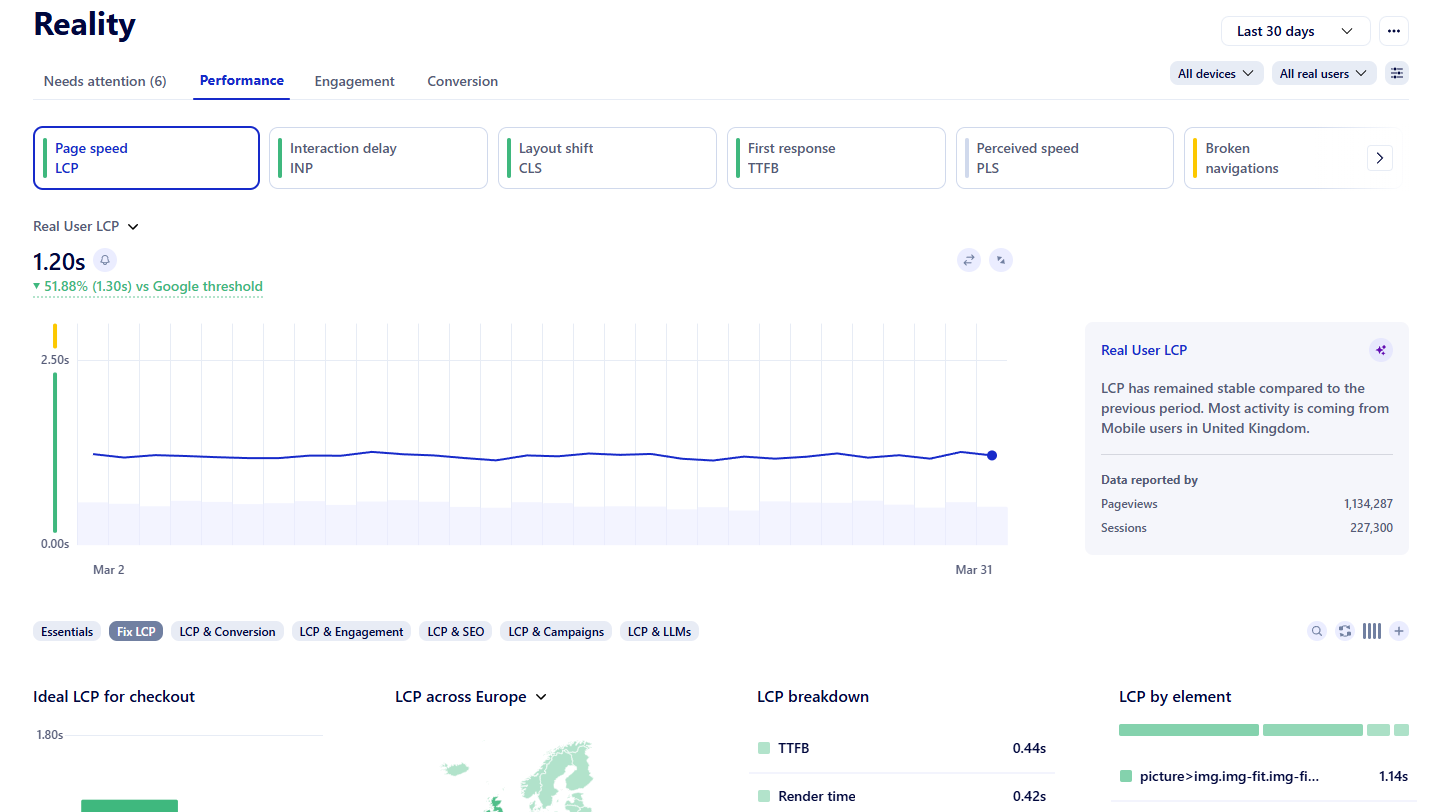
Every Core Web Vital. Every broken request. Every drag on revenue.
Track LCP, INP, CLS, TTFB, PLS - alongside broken navigations, broken images, broken scripts, and broken styles. All in one place, all unsampled.
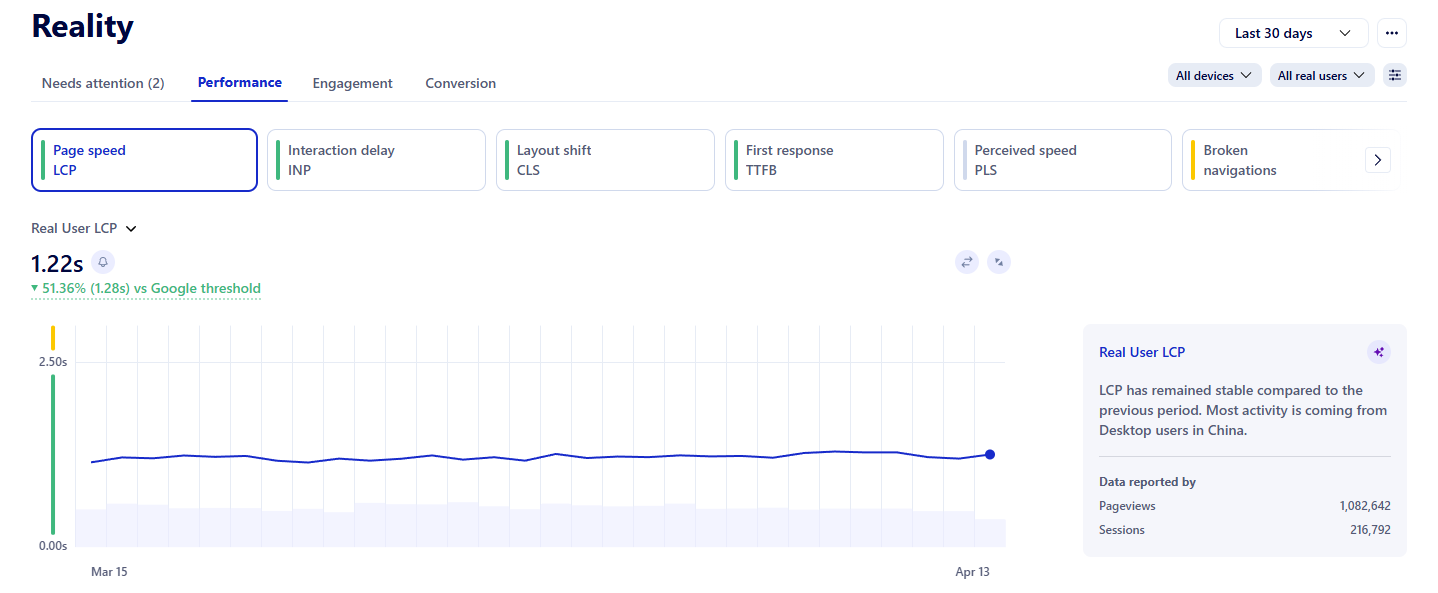
From 1-year trends to minute-by-minute
Every graph zooms from a 12-month view down to the last hour. Each period comes with an AI summary that explains what changed, when, and which segments drove it.
Simulate before you ship
See the site-wide impact of a fix before you commit engineering time. "If we cut LCP by 40% on the homepage, will the whole site pass Core Web Vitals?" - Reality answers it.
Compare anything to anything
Period-over-period. With Navigation AI vs. without. Your site vs. the industry. Mobile vs. desktop. Compare any two slices and see what's actually different.
Ask Uxi about any number
See a metric you don't understand? Click it and ask Uxi. Your personal AI agent knows your data, your filters, and your business - and answers in plain language.
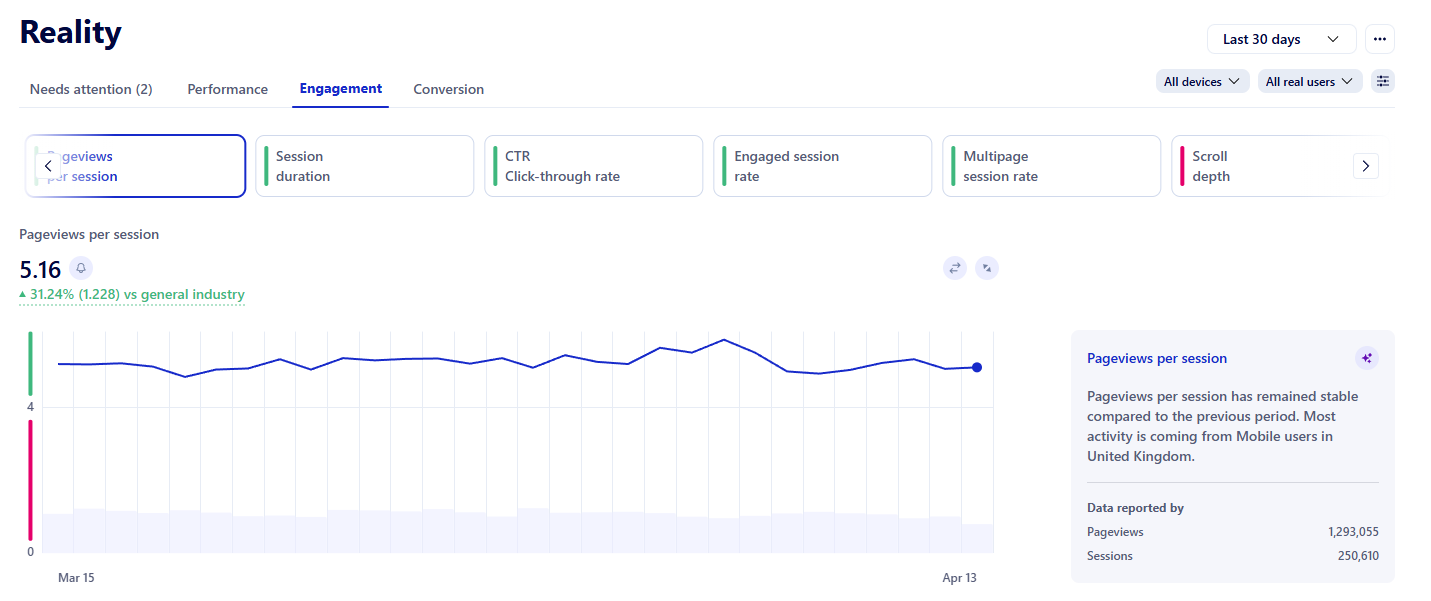
The behavior signals that explain why people leave
Bounce rate is just the beginning. Reality tracks rage clicks, dead clicks, scroll depth, time-to-engage, form abandonment - every behavioral cue that tells you whether your site is working.
Watch behavior shift in real time
Every engagement metric on a graph, with an AI summary explaining the trend across any time window from an hour to a year.
Compare any two periods or segments
See exactly how a campaign launch shifted scroll depth. How a redesign affected rage clicks. The diff between mobile and desktop, week-over-week.
Ask Uxi about any behavior
"Why did engagement drop on mobile last Tuesday?" Uxi pulls the answer from real session data - no analyst required.
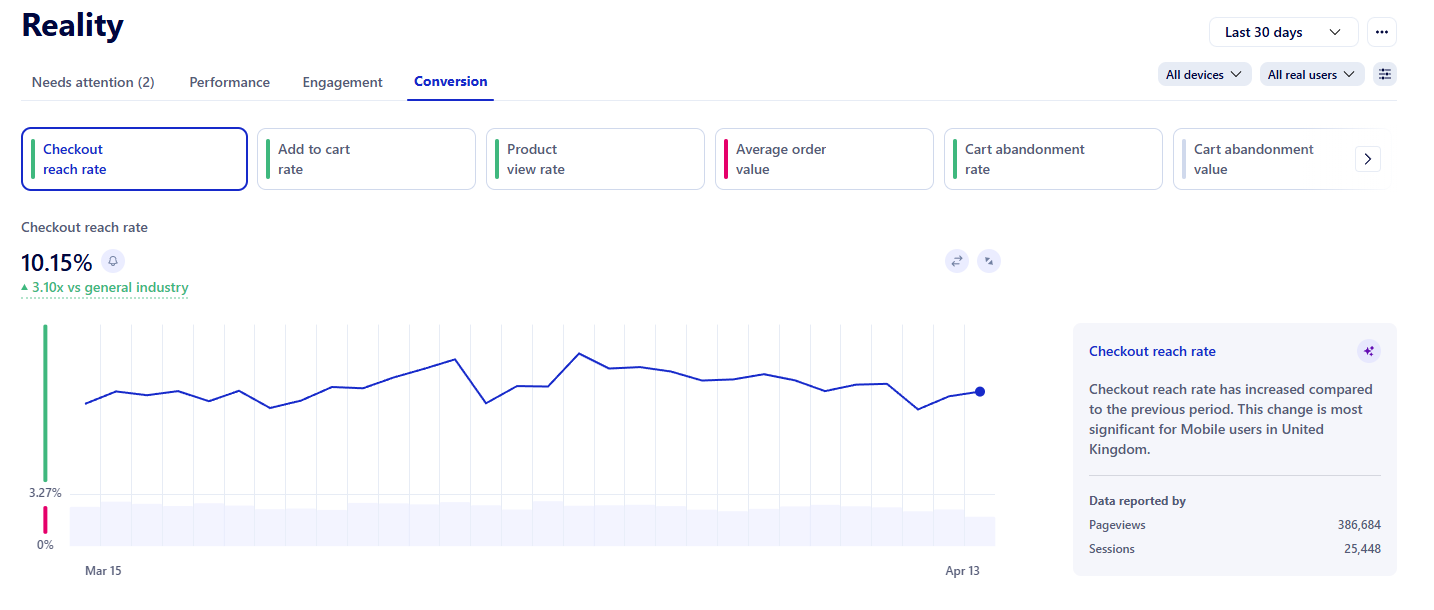
The business metrics that match your business model
Reality adapts to what you sell. Ecommerce gets checkout reach rate, AOV, cart abandonment. SaaS gets trial-to-paid funnels. Blogs get content engagement.
Track the metrics that match your business
Reality adapts to ecommerce, SaaS, and content sites. Conversion graphs show the funnel steps that move your specific revenue model.
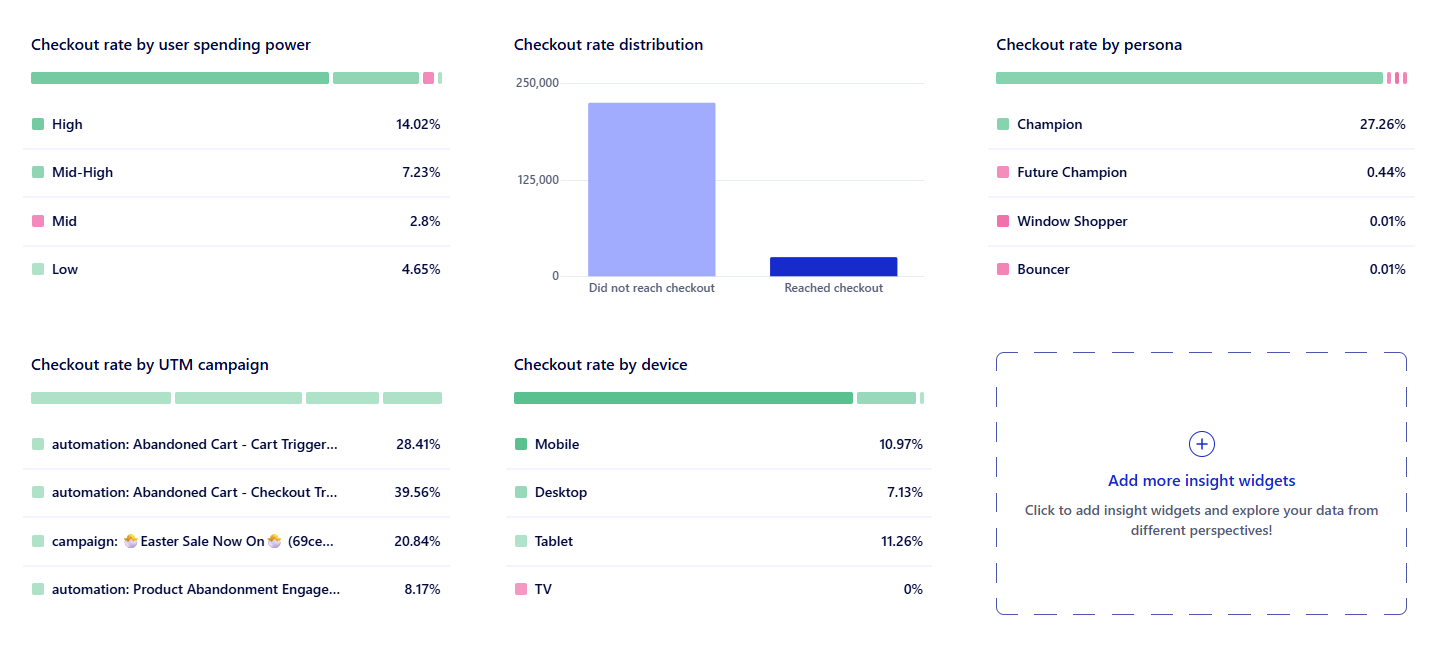
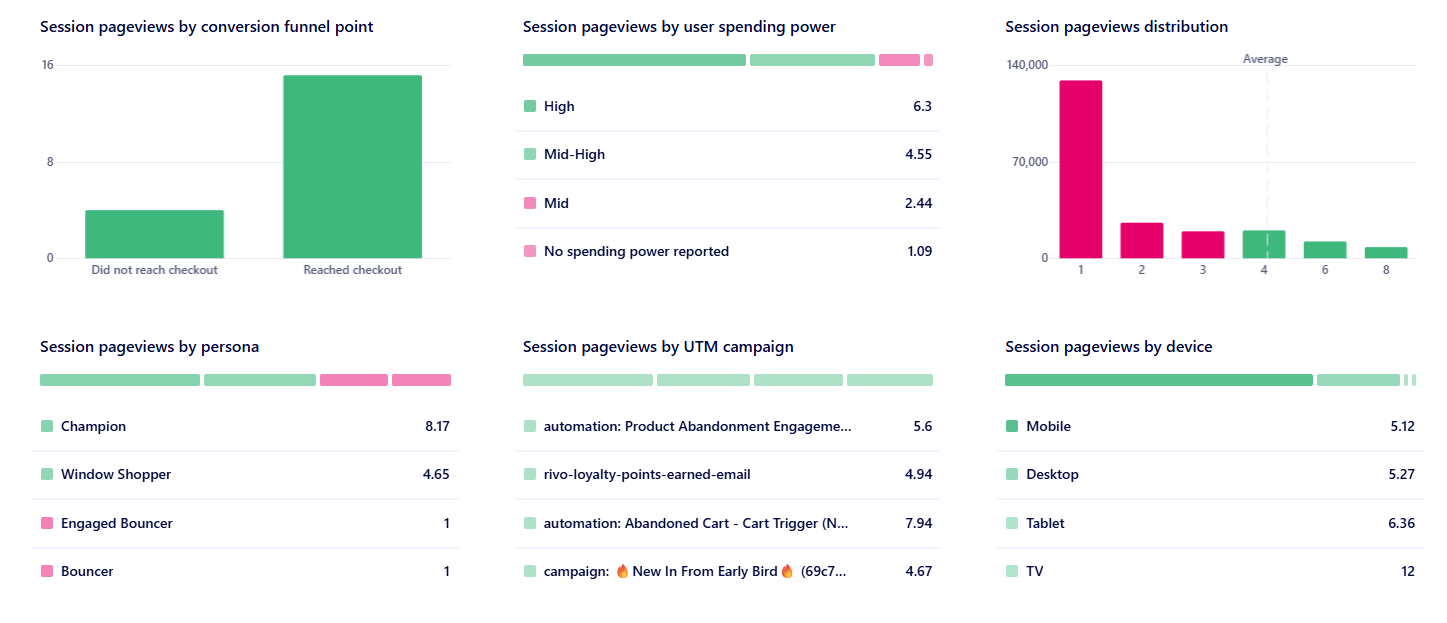
Compare campaigns, devices, and personas
See which UTM source actually converts. Which device crushes AOV. Which persona abandons checkout the most. Ranked, side by side.
Ask Uxi about any conversion drop
"Why did checkout reach rate drop on iPhone 14 last week?" Uxi answers, with the underlying sessions to back it up.
The difference
Uxify Reality vs. other RUM tools
- Business impact
- Perceived speed
- Agentic AI
- Metric simulation
- Safari & Apple support
- Custom metrics
- Data depth
- Links UX directly to conversions & revenue
- Measures how fast users feel the site is
- AI that finds issues, explains, and suggests fixes
- Test "what-if" scenarios before changes go live
- Full coverage, including Safari & iOS
- Define and track your own UX/business KPIs
- 3000+ signals captured (granular UX, funnels, personas)
- No ROI connection
- Not measured
- Static dashboards only
- Not available
- Partial
- Fixed metrics only
- Up to 2k signals
Consentmo campaign revenue up by 38%
Consentmo used Uxify Reality to identify why their best-performing campaign wasn't converting as expected. CPS and LCP were within acceptable ranges, but three times slower than expected, creating friction at first impression and delaying business performance issues. Consentmo, acting on these insights and fixing performance issues, saw increased revenue, engagement, and drove a 38 percent lift in campaign ROI.
Here's what our customers say

I have first-hand experience that the Uxify product is in a class of its own. It's been instrumental in helping me pass and exceed my core web vitals, which has significantly impacted my organic traffic.

Steve Hutt
ex-Shopify | DTC Founder | Podcast Host
In summary, Navigation AI offers a smart, efficient, and user-friendly solution to website speed optimization, making it an invaluable asset for any online platform aiming to improve user engagement and retention.

Panos T.
CEO

I'm genuinely surprised more people in Tech SEO aren't talking about the Speculation Rules API yet. Companies like Uxify are already putting it to work, and the results we're seeing are insane. Here's a real example from one of our clients: LCP improved by 53% TTFB dropped from 0.7s to 0.2s +56% more pageviews All thanks to preloading and prerendering pages before the user even clicks. It's not another "PageSpeed tweak." It's a new way of thinking about performance.

Fabien Galet
Head of SEO & CRO at MindArc
Most common questions
What is Reality in Uxify?
Reality is Uxify's diagnostic platform - one workspace that unifies performance, engagement, and conversion data for every real user. Instead of swapping between a RUM tool, an analytics tool, and a conversion tool, you see exactly where revenue is slipping and what is causing it, all in one place.
How is Reality different from Google Analytics or standard RUM tools?
Standard RUM tools stop at Core Web Vitals and generic averages. Google Analytics samples data and stops at clicks. Reality uses unsampled, real-user data and ties every technical metric (LCP, INP, CLS, TTFB, PLS) to engagement and revenue - then highlights the segments and pages actually costing you conversions.
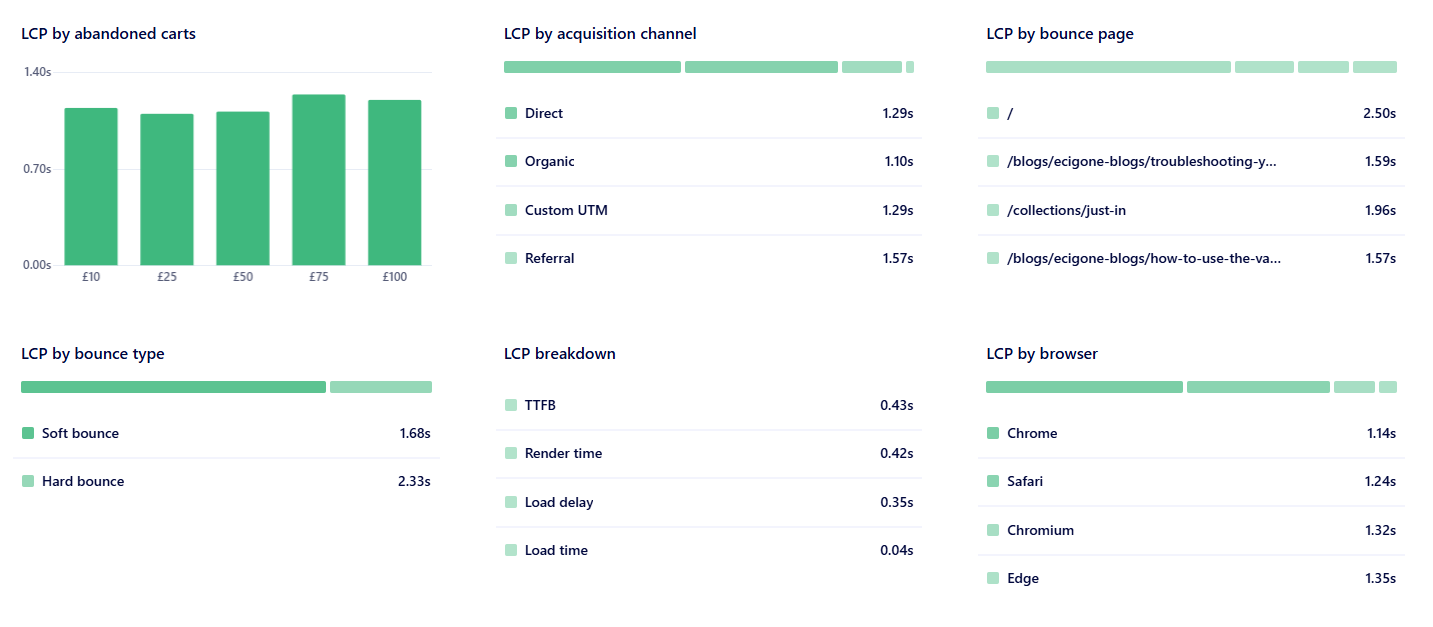
What can I diagnose with the Insights library?
Every metric in Reality can be sliced across 60+ dimensions - acquisition channel, device, country, browser, persona, funnel step, UTM campaign, landing page, and more. That means you can pinpoint the exact segment driving a bad LCP, a drop in engagement, or an abandoned cart, instead of guessing from a single average.
What does the Simulate feature do?
Simulate (available in the Performance tab) models the site-wide impact of a hypothetical fix before you ship it. For example, if most traffic lands on your homepage and LCP is slow, Simulate shows whether fixing only the homepage is enough to pass Core Web Vitals for the whole site - so you prioritize fixes that actually move the metric.
Can Reality explain why a metric changed?
Yes. Every graph in Reality comes with an AI summary that explains what changed, when it changed, and which segments drove the change for the selected metric, filters, and time range - from the last hour to the last year. You can also one-click Ask Uxi, Uxify's AI agent, for deeper follow-up questions on any number you see.
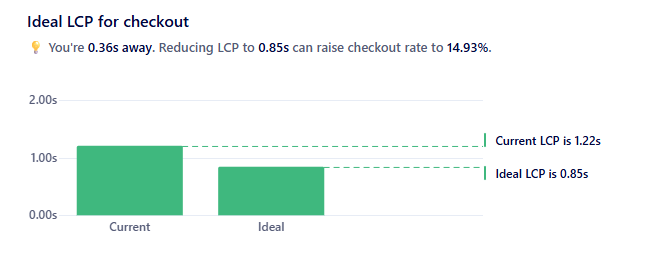
Does Reality work for ecommerce, SaaS, and publisher sites?
Yes. The Conversion tab adapts to your site type - ecommerce (AOV, cart abandonment, add to cart rate), SaaS (signups, demos, activation), and content sites (engaged sessions, scroll depth, return rate). Performance and Engagement tabs are universal, and the AI-enhanced insights calculate targets (like an ideal LCP for your checkout) based on your own conversion data, not generic benchmarks.